Improving the Performance of Your Dashboards
Slow dashboards are a database architecture problem. Running analytical queries (aggregations, wide scans, time-series breakdowns) on your transactional database degrades everything: dashboard latency, core app reliability, and your team's ability to ship new metrics without capacity planning.
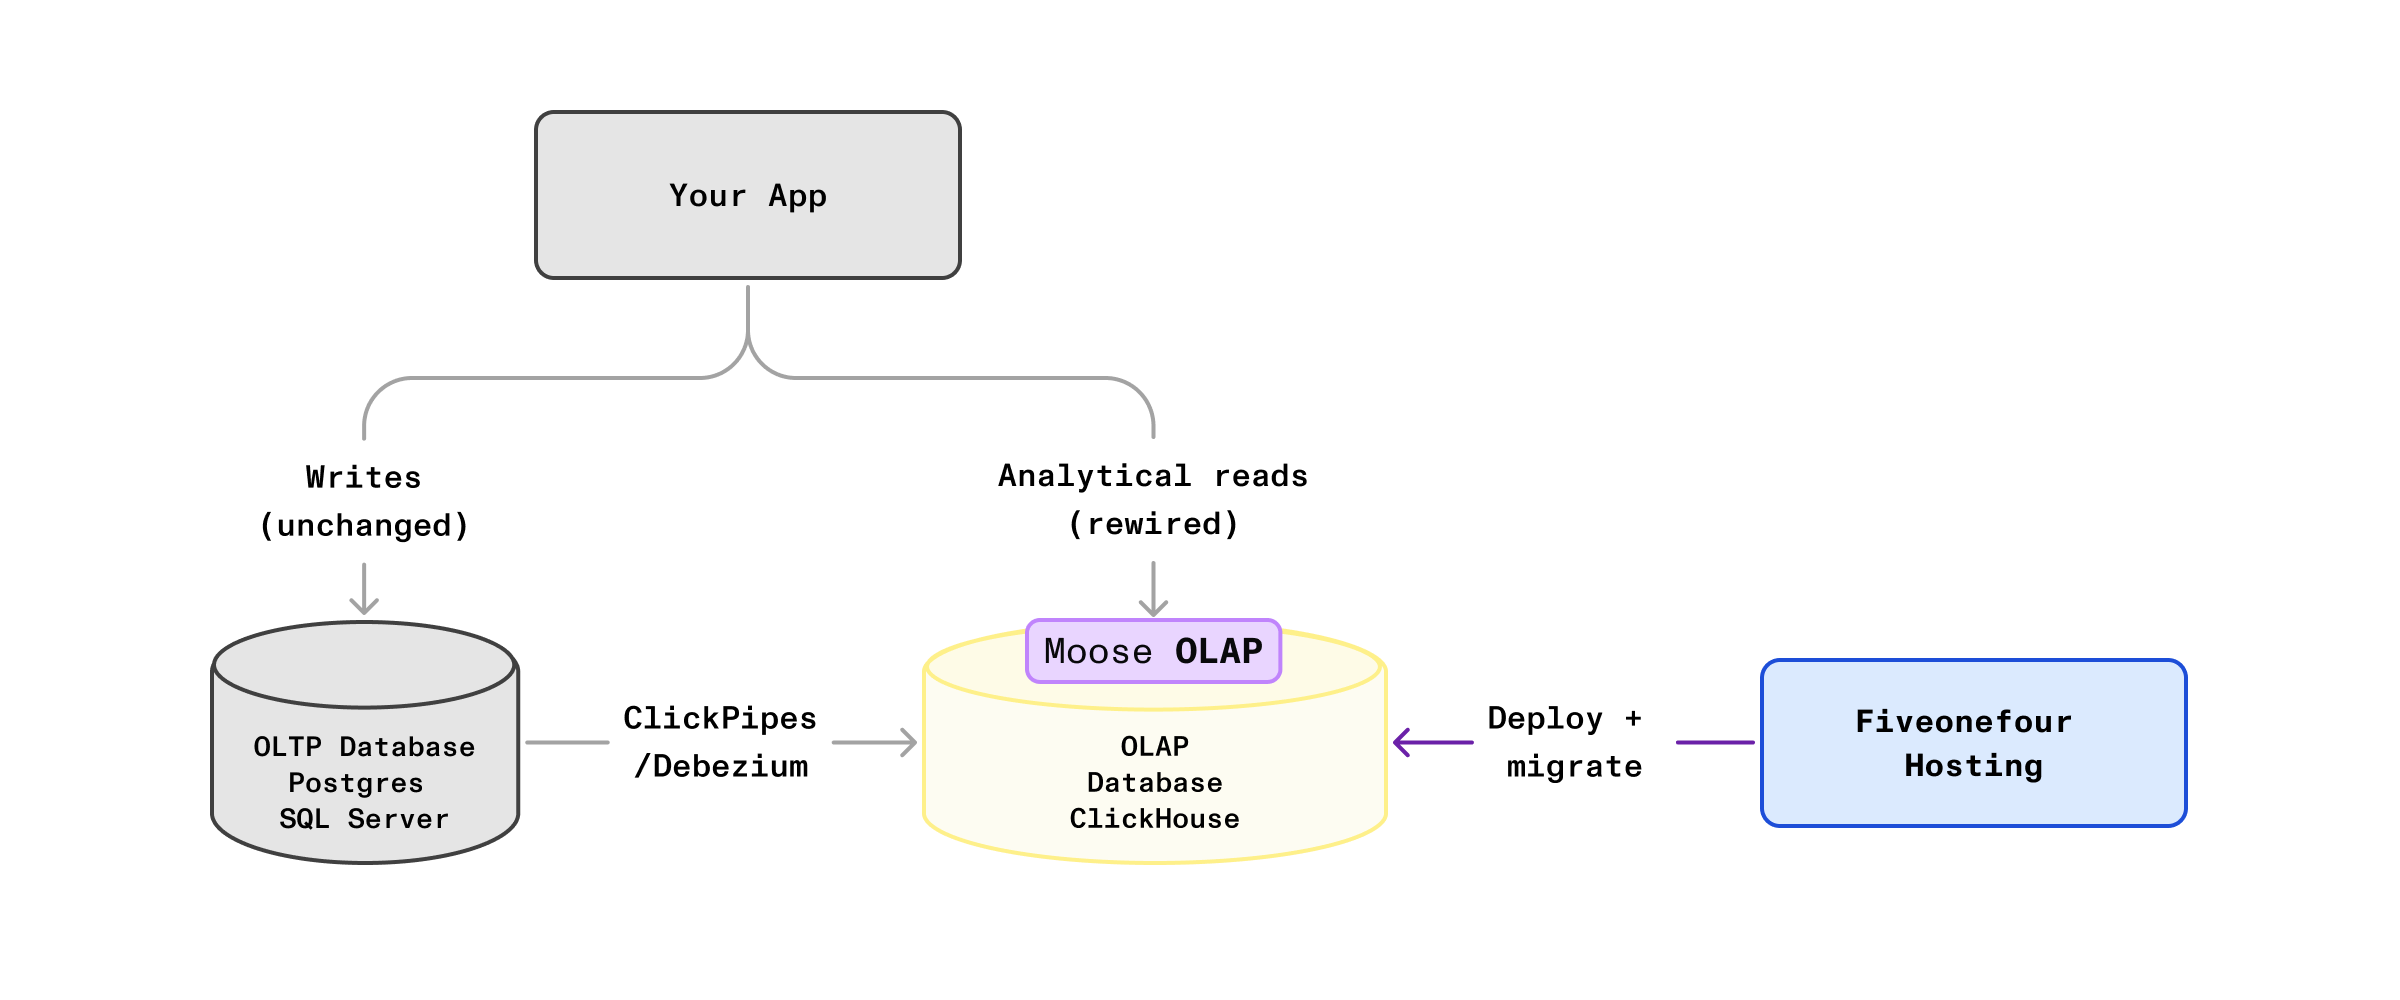
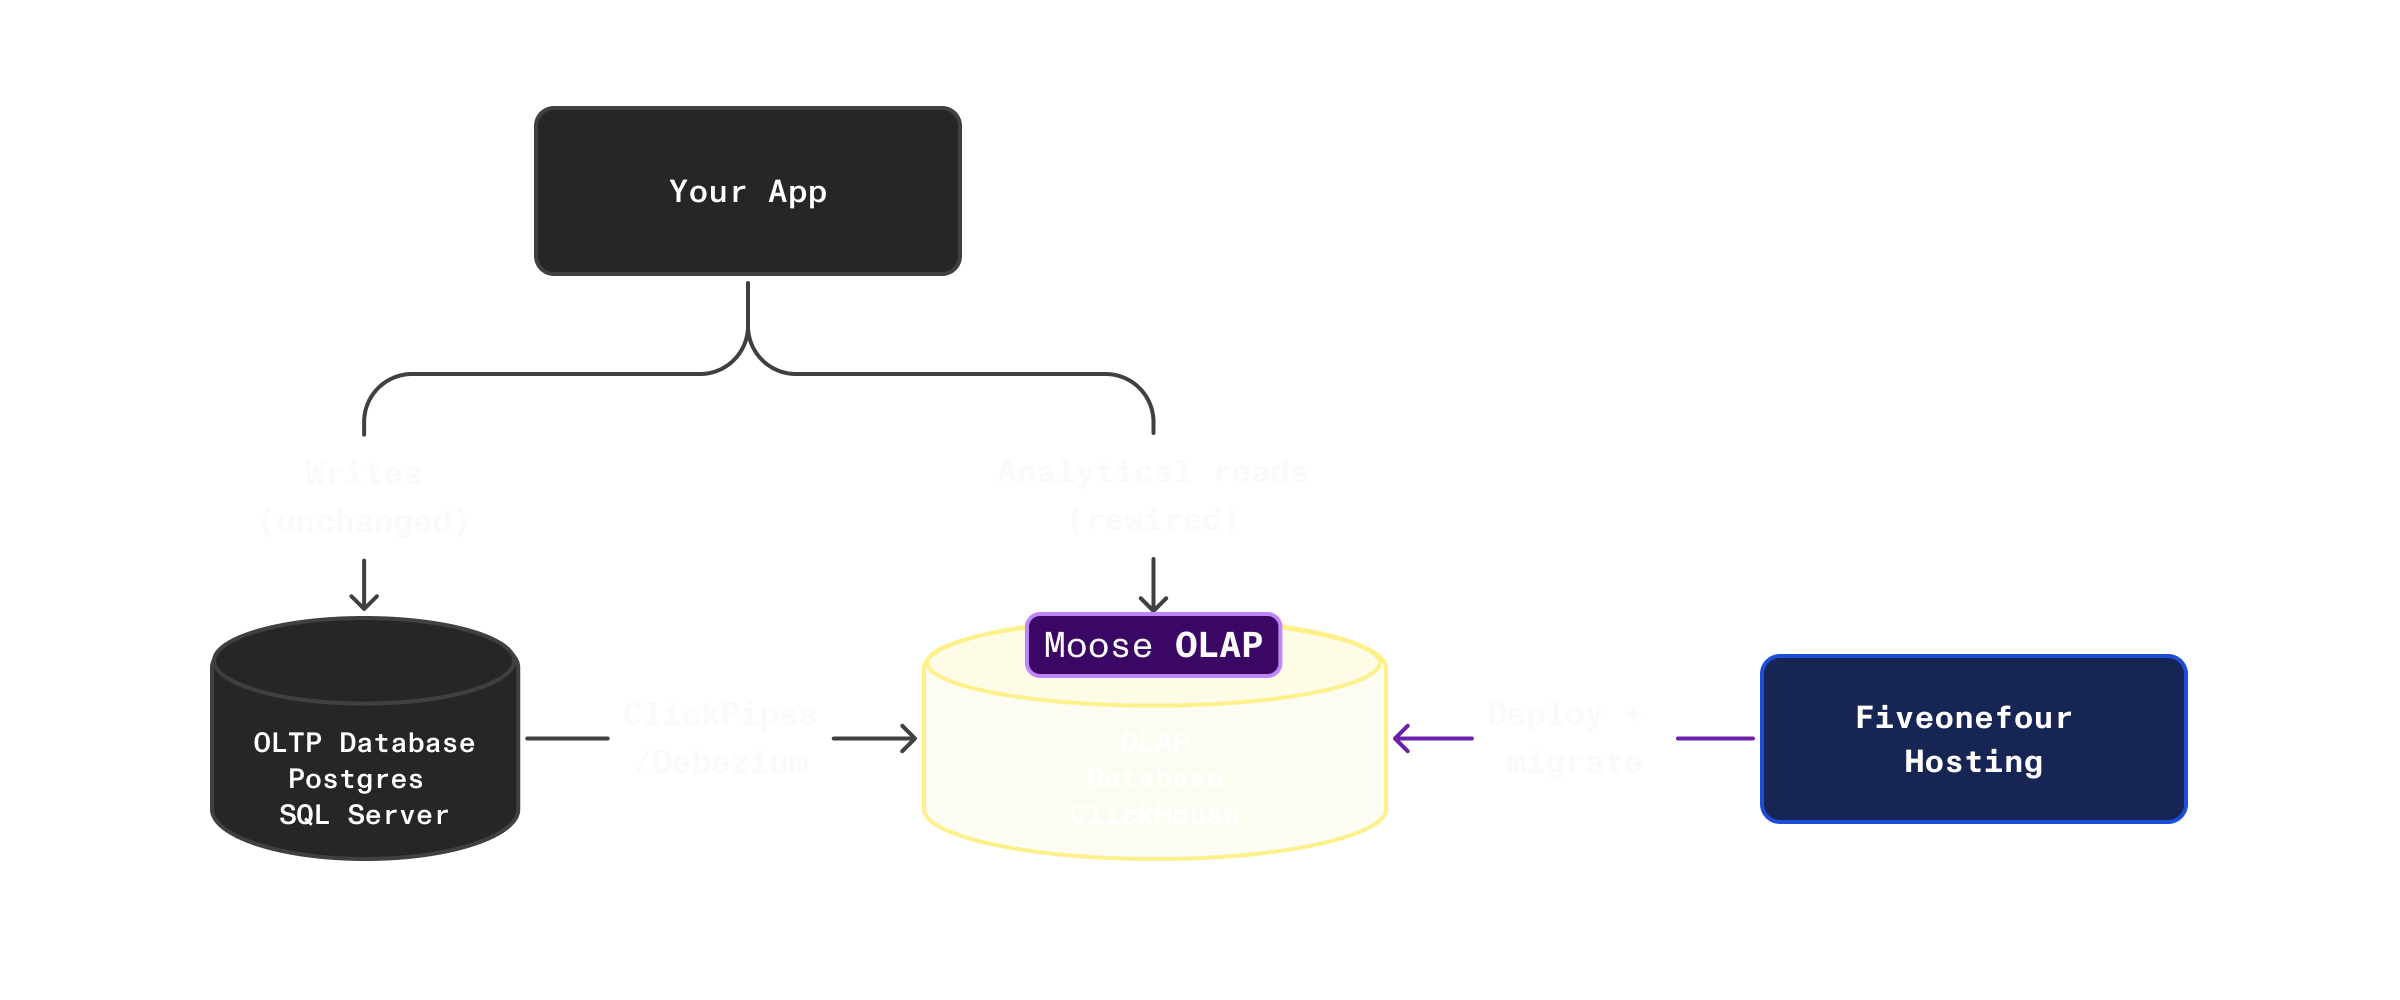
This guide walks you through adding a dedicated analytical layer (ClickHouse) alongside your existing OLTP database, in order to drastically improve the performance of your dashboards. In order to accelerate your implementation, especially with AI coding agents, this guide utilizes MooseStack, 514 hosting, and a supporting toolchain (dev MCP server, language server, CLIs, and ClickHouse skills) that form an agent harness for AI-assisted migration. You keep your source database as the system of record, replicate the data your dashboards need via CDC, and rewire analytical reads to ClickHouse. Transactional CRUD stays unchanged.
Architectures covered by this guide
| Source database | CDC method | App language |
|---|---|---|
| Postgres | ClickPipes (managed by ClickHouse Cloud) | TypeScript |
| SQL Server | Debezium (self-hosted) | TypeScript |
Get Started
Starting from scratch?
Need a different source or language?
Accelerating migrations with MooseStack: the agent harness for your analytical stack
AI agents are good at writing code, but OLAP migrations fail when agents lack the right constraints: they don't know ClickHouse idioms, they can't validate their own output, and they have no way to catch mistakes before production. The harness solves this by keeping the agent inside the OLAP paradigm, letting it write in languages it already knows (TypeScript, not DDL scripts), and giving it tools to check its own work in fast, increasingly scoped feedback loops.
MooseStack gives you a development framework where your entire ClickHouse analytics layer (tables, materialized views, serving tables, and query handlers) lives in version-controlled TypeScript. You use an AI copilot (Claude Code, Cursor, Codex, or any MCP-capable editor) inside this structured harness:
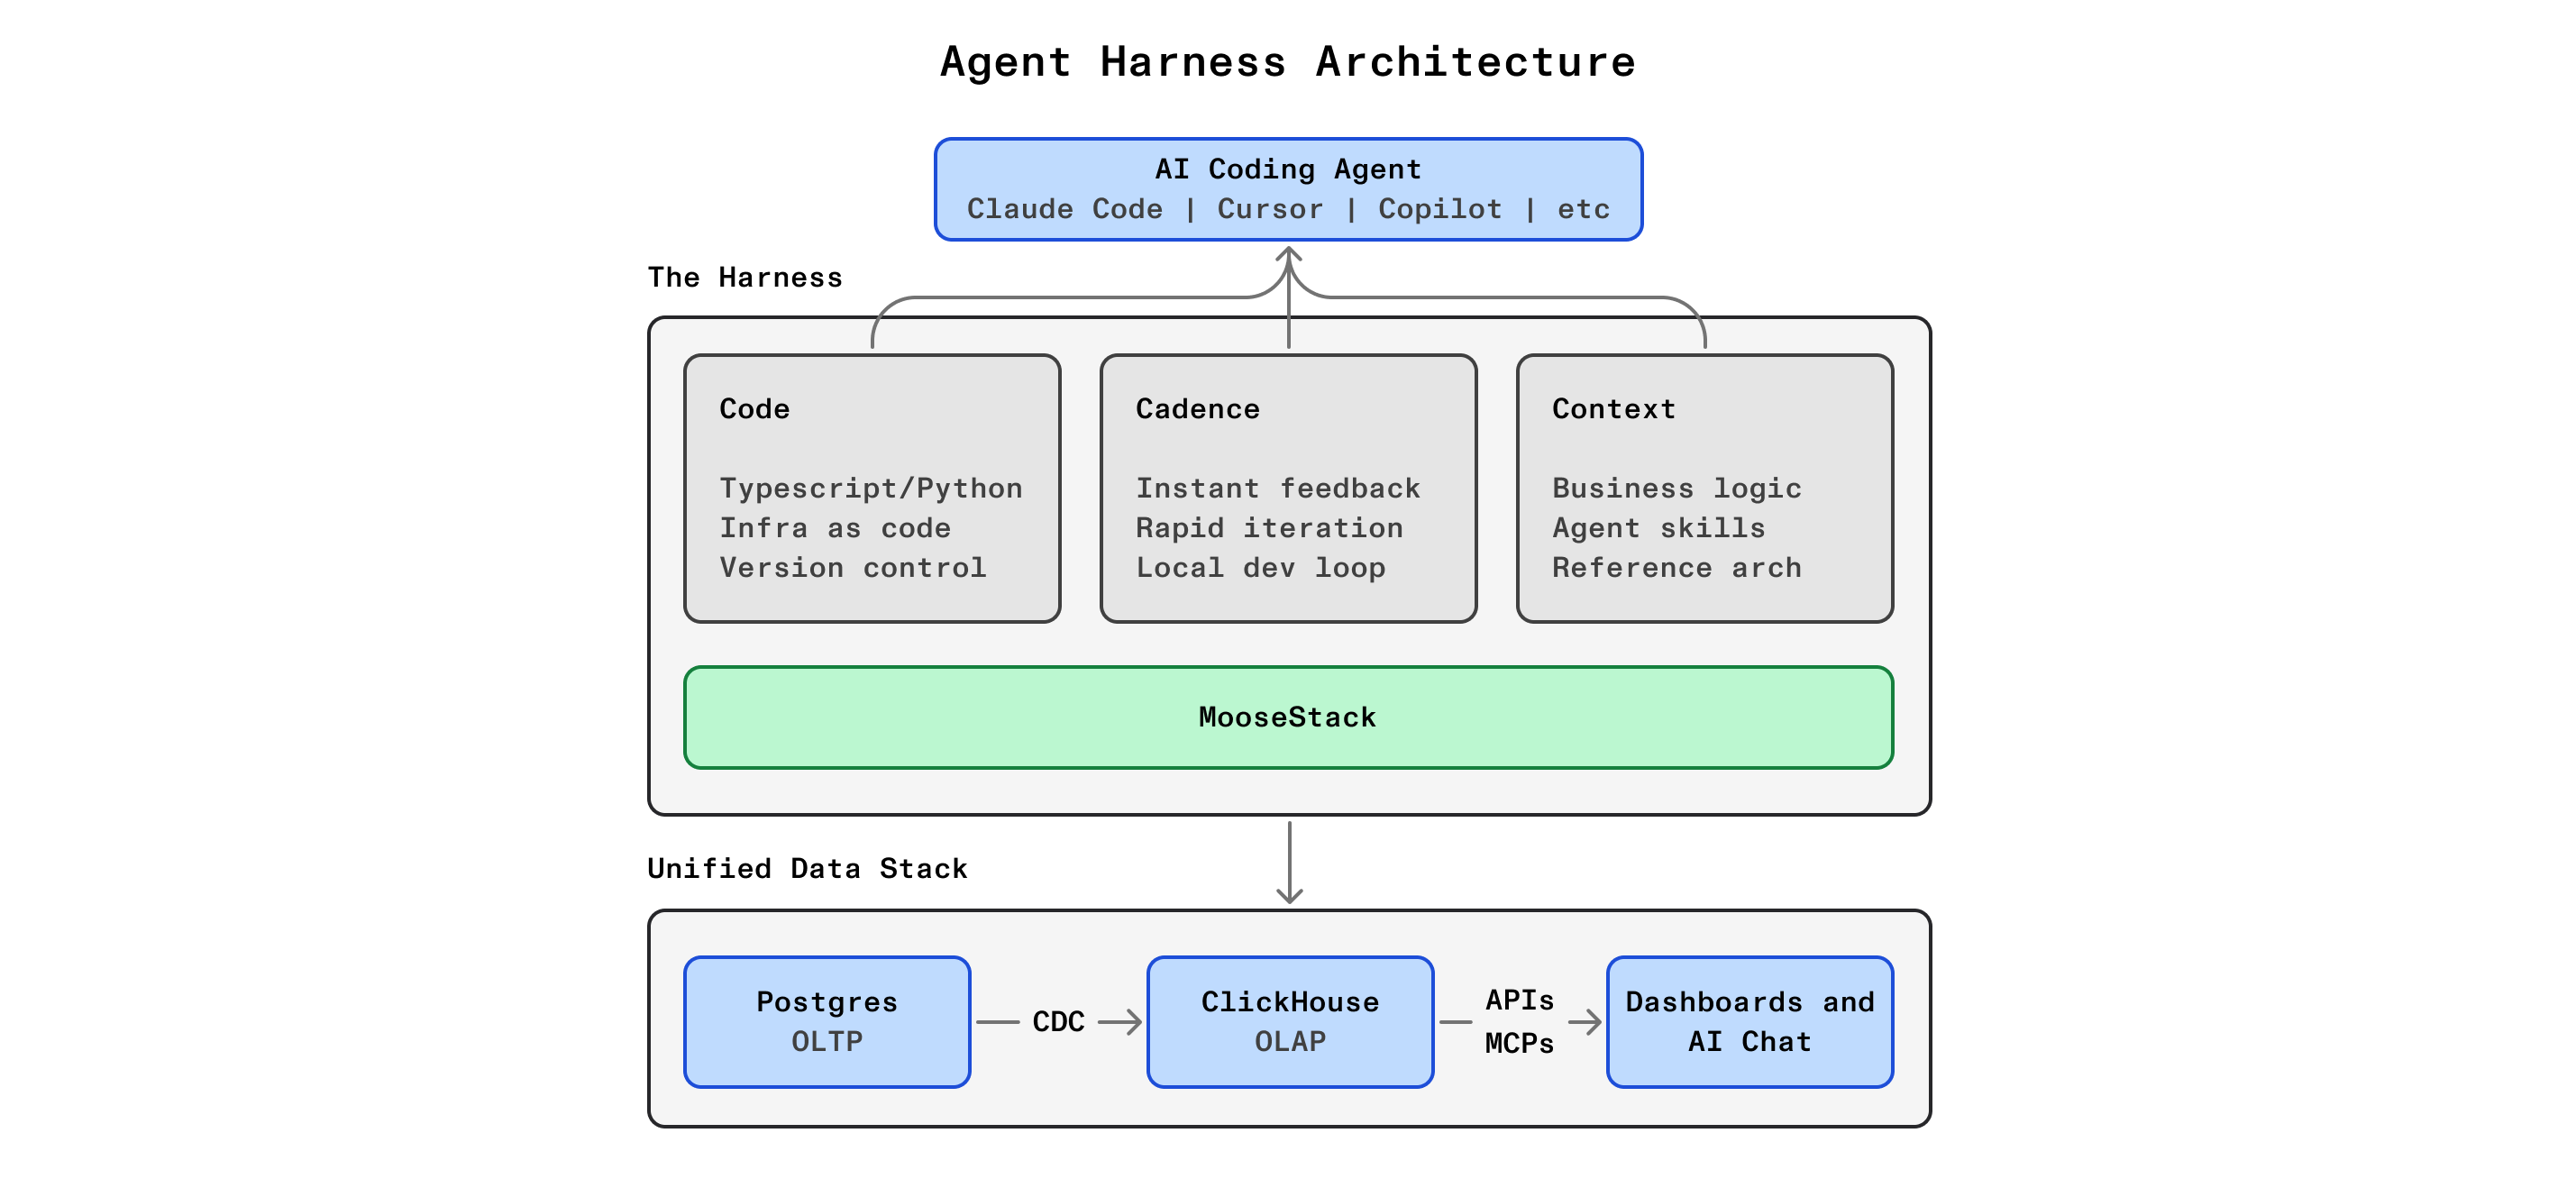
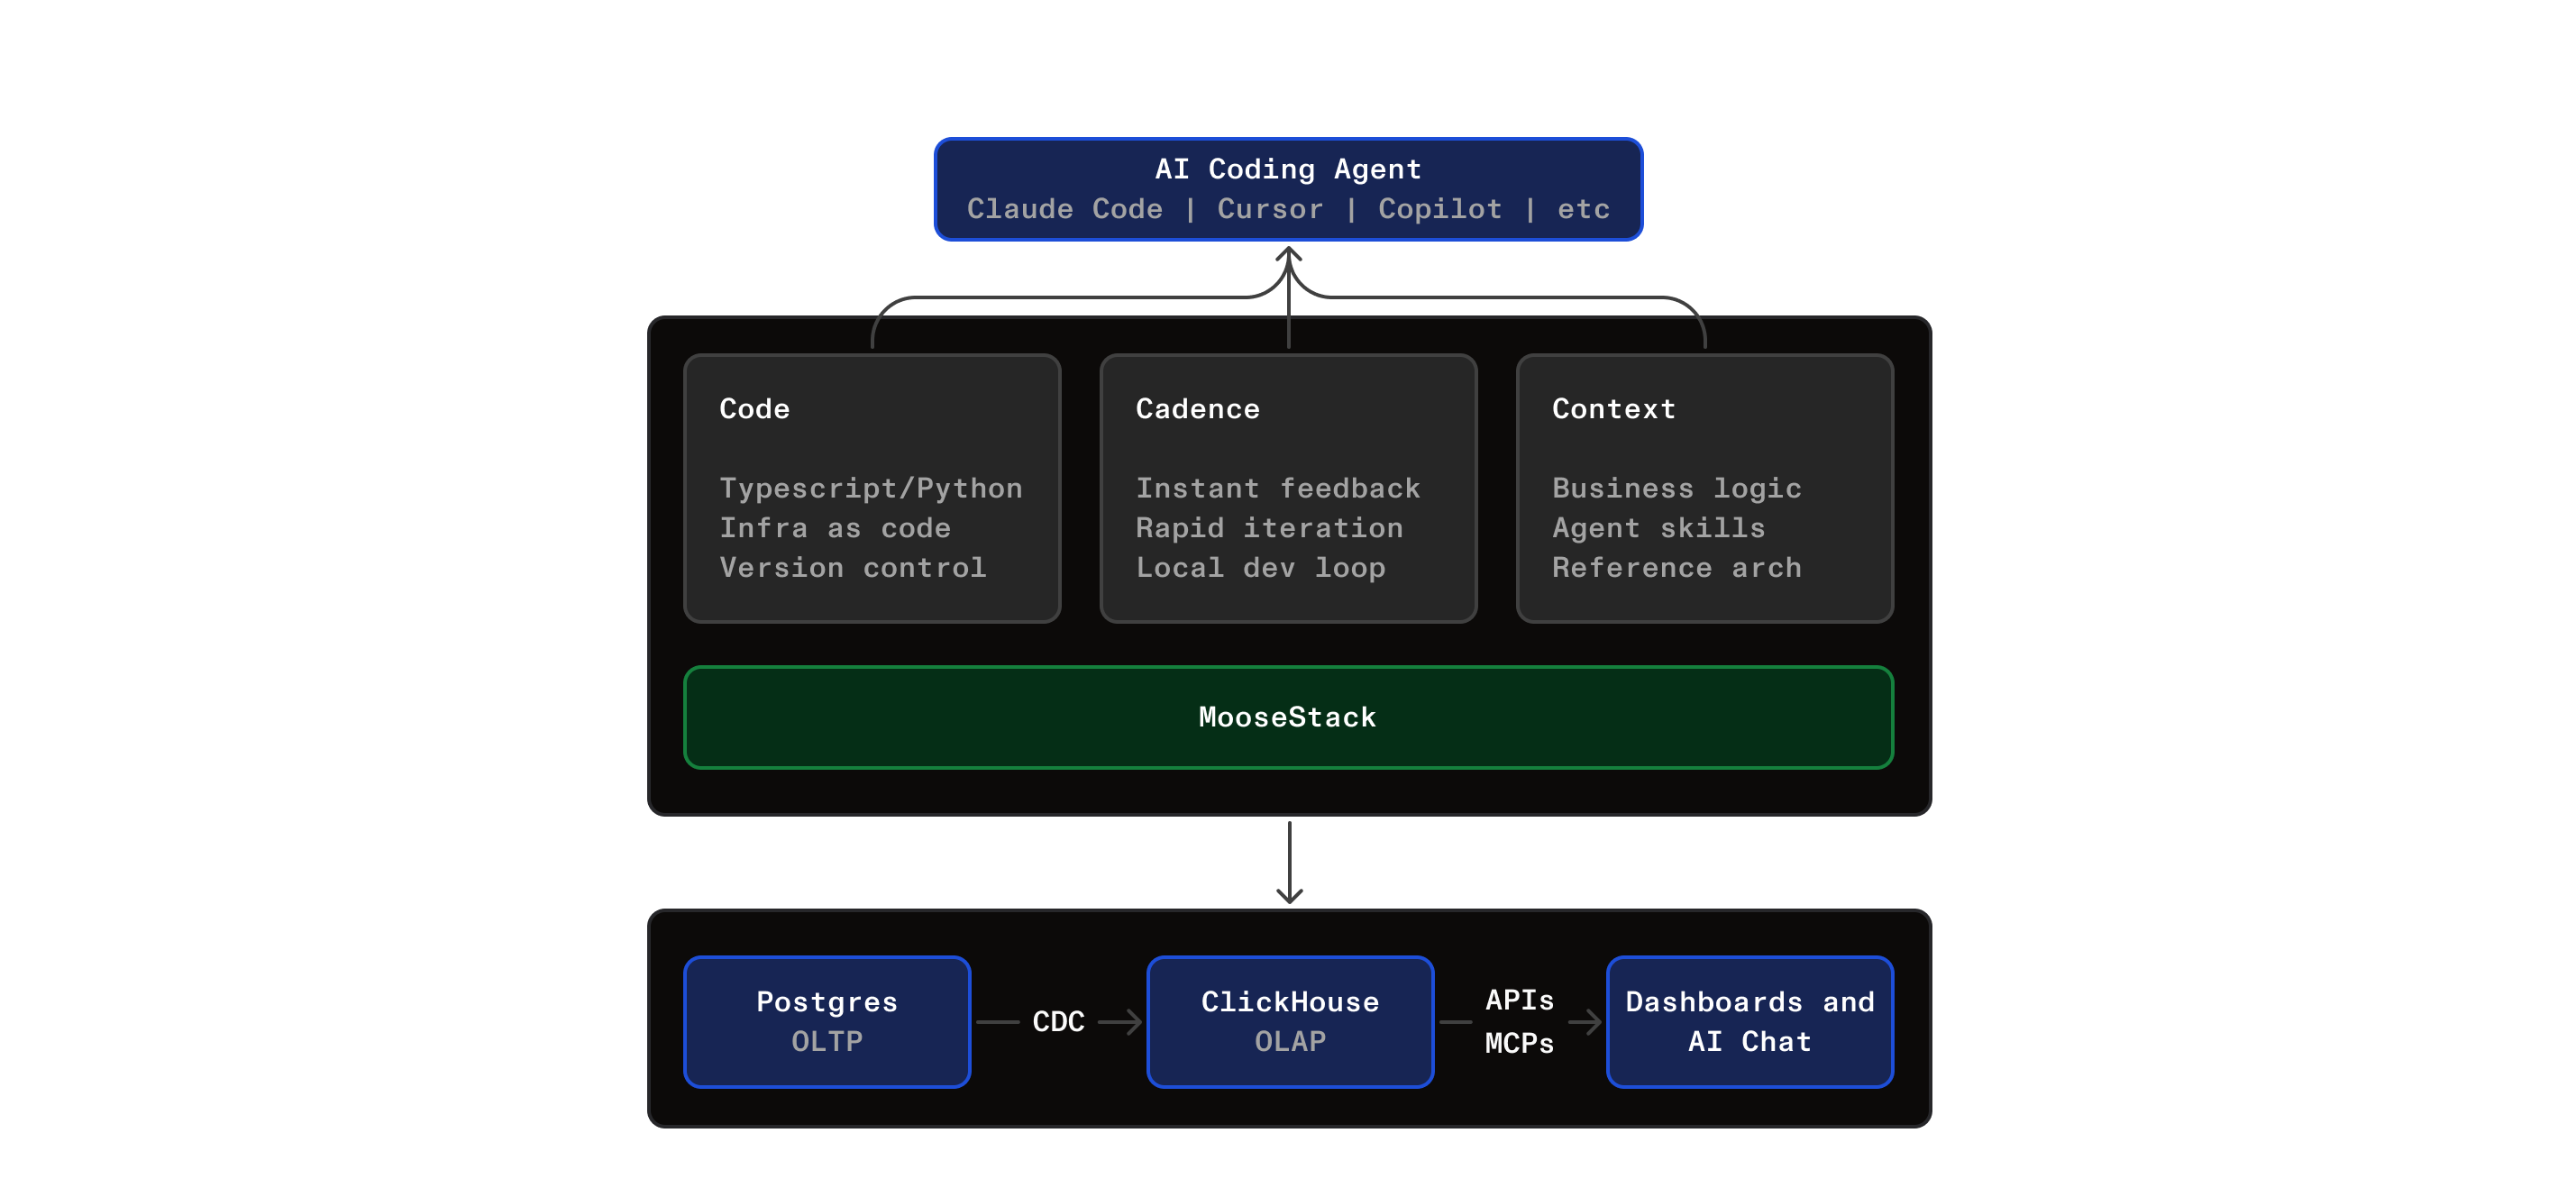
Code: everything is typed objects with a dependency graph. The agent reads and writes TypeScript, not raw SQL or YAML. Type errors surface at write time, not after deployment.
Cadence: three nested feedback loops catch errors at increasing scope. The IDE catches type and SQL errors instantly, moose dev catches runtime and schema errors in seconds, and 514 Hosting's preview environments catch deployment and scale errors in minutes. The tightest loop that catches the error wins.
Context: the agent works with ClickHouse-specific skills, live query validation with LSP, local dev environment validation with MooseDev MCP, reference implementations, copilot prompts, test fixtures, and a structured context workspace. Not raw LLM training data: curated, task-specific context.
You work through three phases per dashboard component: parity translation (make the same query work on ClickHouse), optimization (materialized views and serving tables for production performance), and query layer (type-safe API handlers that replace your OLTP read path). Each phase is validated before you move on.